
Traffic incidents are among the biggest causes of fatalities in the US. On average, 117 deaths occur every day in the US due to traffic accidents. The NHTSA reveals that in the first half of 2023 alone, there were approximately 19,515 fatal crashes.
In this article, we’ll look at the latest statistics on how many car deaths in the US each year. Besides, we’ll discuss the main causes of fatalities, and compare the main trends in 2023 vs. 2022 by states. So let’s get started!
In the first quarter of 2023, there were about 286 million vehicles on the roads of the US. On average, car accidents injure about 2.5 million people every year, and 0.7% of all crashes are fatal. But to see a complete situation, let’s look at the main trends for each year.
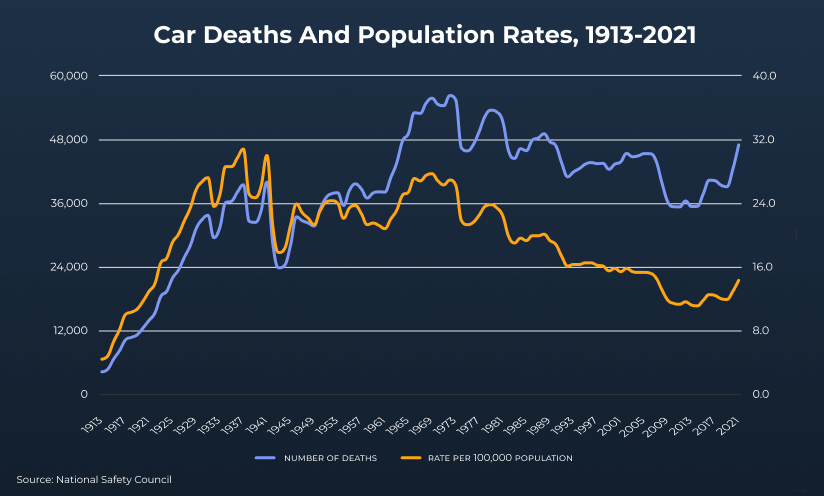
On average, over the past 12 years, about 36.690 people have died in road accidents every year. During this time, the number of fatalities increased by almost 32%. 2021 was a record year, with a total of almost 43k deaths. But there was a slight decrease of 0.3% in 2022 compared to 2021.
Here’s a quick look at how many car deaths in the US each year with the annual changes.
2011
32,479
-
2012
33,782
↑ 4.0%
2013
32,893
↓ 2.6%
2014
32,744
↓ 0.5%
2015
35,484
↑ 8.4%
2016
37,806
↑ 6.5%
2017
37,473
↓ 0.9%
2018
36,835
↓ 1.7%
2019
36,355
↓ 1.3%
2020
39,007
↑ 7.3%
2021
42,939
↑ 10.1%
2022*
42,795
↓ 0.3%
2023 (Jan-Jun)*
19,515
↓ 3.3%**
*2022, 2023 statistical projections based on FHWA June 2023 Traffic Volume Trends for 2022 and 2023 VMT.
**compared to the first half of 2022
Source: NHTSA
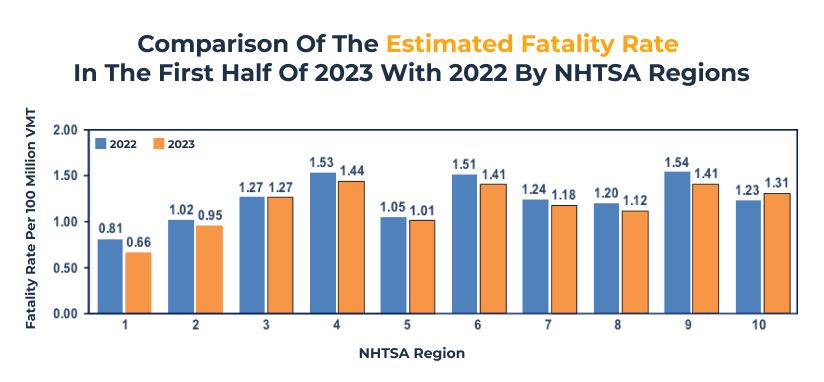
The fatality rate of car accidents per mile driven has been increasing over the years. In 2013, the rate was 1.10, while it peaked at 1.37 in 2021.
The spike in deaths in 2020 and 2021 appears to be due to changes in driving patterns during the pandemic. For example, less congested roads, which lead to higher speeds. But in 2022, the rate decreased to 1.35 and further to 1.24 in the first half of 2023.
Here is a fatality rate per 100 million vehicle miles traveled (VMT):
2013
1.05
1.10
2014
1.01
1.08
2015
1.06
1.15
2016
1.14
1.19
2017
1.13
1.17
2018
1.11
1.14
2019
1.07
1.11
2020
1.25
1.34
2021
1.33
1.37
2022*
1.31
1.35
2023*
1.24
-
*2022, 2023 statistical projections based on FHWA June 2023 Traffic Volume Trends for 2022 and 2023 VMT.
Source: NHTSA
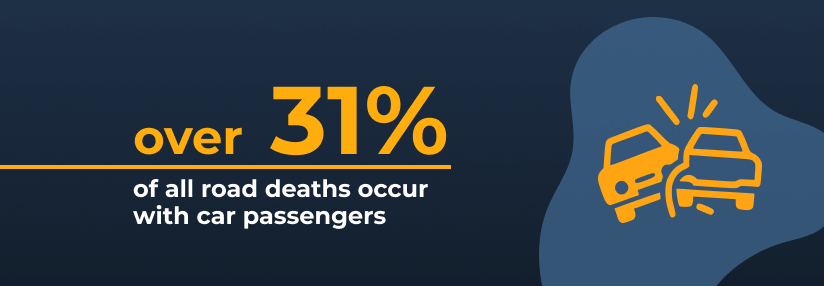
Truck occupants account for the highest percentage of fatalities (32.15%). Next are passengers of cars (31.51%). In turn, the lowest number of highway deaths occurs among bus passengers.
Here is a full breakdown of how common are car accidents with fatalities by vehicle type in the US:
Passenger car occupants
13,529
31.51%
Motorcyclists
5,932
13.81%
Truck occupants
13,804
32.15%
Bus occupants
14
0.03%
Pedestrians
7,388
17.21%
Pedal cyclists
966
2.25%
Other incidents*
1,306
3.04%
* Includes passengers in other types of vehicles, other non-motorized persons, and unknowns.
Source: Bureau of Transportation Statistics
According to 2021 data, about 1,500 children under the age of 14 died in road accidents. Seniors over the age of 75 are also often victims of incidents (9%).
But, the 25-44 age group has the highest number of deaths, accounting for 34% of the total fatalities. In fact, the 45-64 age group also has a high fatality rate, making up 28% of the total deaths.
Here is a more detailed look at the most recent data on car accident fatalities in the US by age group.
0-4
480
1%
5-14
979
2%
15-24
7,425
16%
25-44
16,040
34%
45-64
12,950
28%
65-74
4,783
10%
75+
4,323
9%
Source: National Safety Council
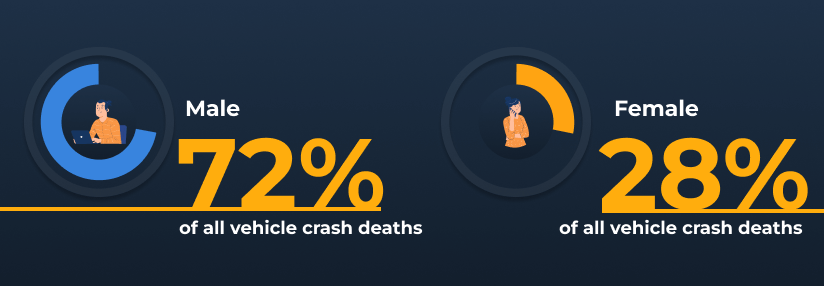
Here are key facts about gender differences in car accident fatalities:
In general, men die in car accidents more often than women, due to their more risky driving habits.
Source: Insurance Institute for Highway Safety
These are the types of collisions that cause the most deaths:
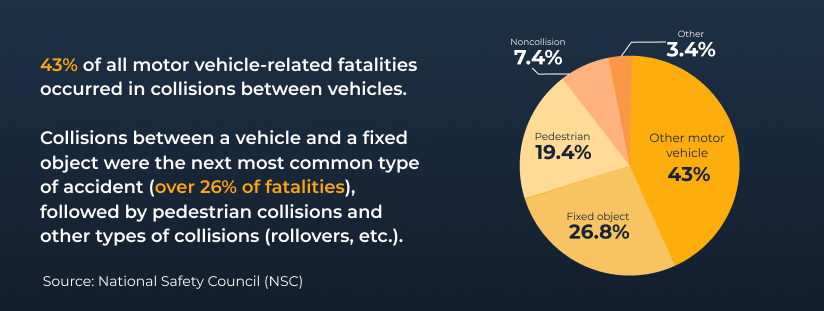
It is worth noting that each type of collision has its own statistics on the age of victims. Here are the main facts:
In a crash with another vehicle, 44.8% of fatalities occur in an angle collision, 29.4% in a head-on, 17.9% in a rear-end, and 8% in a sideswipe.
Source: National Safety Council
In 2021, fatal crashes involved more than 66,600 drivers. Age groups 25-34 (22.5%) and 20-24 (11.4%) had a high percentage of involvement here. They also have the highest rates per 100,000 licensed drivers.
The lower death rate among older drivers suggests that more driving experience leads to a reduced risk of fatal accidents.
Here’s the age of drivers in fatal crashes with a rate per 100,000 licensed drivers in each age group:
16-19
6.3%
52
20-24
11.4%
44
25-34
22.5%
37
35-44
17.4%
29
45-54
14.9%
26
55-64
13.7%
23
65-74
8.1%
17
75+
5.6%
20
Source: National Safety Council
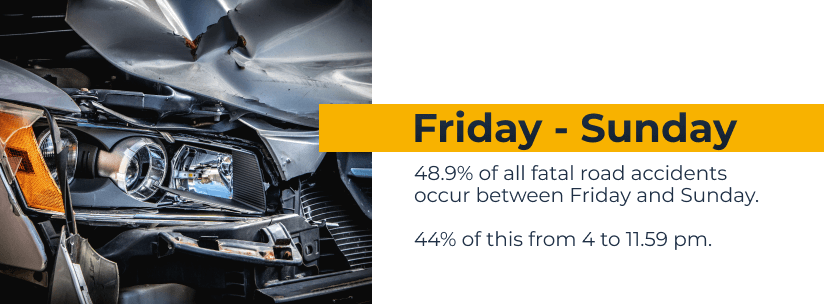
Most fatal accidents occur between Friday and Sunday. On Saturday, more than 17% of all road deaths occur. Friday comes in second with 16.1%. The lowest mortality rate is on Tuesday and Wednesday (12.3% of all fatal accidents).
As for the time of day, the highest number of deaths on the roads was from 4 to 11.59 pm (more than 44% of all deaths).
In 2021, the day with the highest number of road deaths was August 7 with 201 fatal crushes. However, the month with the highest rate was October 2021 with more than 4,100 traffic fatalities.

In the first half of 2023, there were approximately 19,515 fatal crashes. This represents a 3.3% decrease compared to the first half of 2022. Let’s take a closer look at each state’s statistics.
Texas (2,089 deaths) and California (2,061 deaths) are the states with the highest number of traffic fatalities in the first half of 2023. In turn, Alaska (24 deaths) and the District of Columbia (25 deaths) had the fewest road fatal accidents.
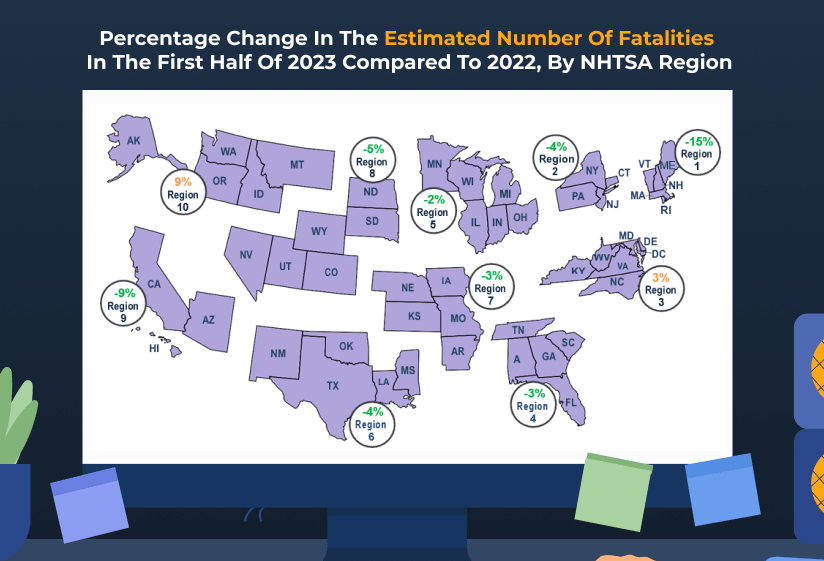
Most states show a decrease in fatalities in the first half of 2023 compared to 2022. The largest one occurred in Maine (-46.6%) and Alaska (-26.3%). But there are some states that show an overall rise of road fatalities. For example, Rhode Island (+193% compared to the first half of 2022) and the District of Columbia (+64.9%).
Here is a more detailed look at the list of car accidents by state with estimated fatalities in the first half of 2023 compared to 2022:
Alabama
479
460
↓ 4.1%
Alaska
33
24
↓ 26.3%
Arizona
627
655
↑ 4.5%
Arkansas
281
290
↑ 3.2%
California
2,341
2,061
↓ 12.0%
Colorado
342
325
↓ 4.8%
Connecticut
181
161
↓ 11.0%
Delaware
75
77
↑ 2.4%
District of Columbia
15
25
↑ 64.9%
Florida
1,840
1,772
↓ 3.7%
Georgia
881
764
↓ 13.3%
Hawaii
62
47
↓ 24.0%
Idaho
79
103
↑ 29.7%
Illinois
598
599
↑ 0.2%
Indiana
447
422
↓ 5.5%
Iowa
150
171
↑ 14.1%
Kansas
195
194
↓ 0.6%
Kentucky
334
364
↑ 9.1%
Louisiana
428
375
↓12.3%
Maine
84
45
↓ 46.6%
Maryland
272
293
↑ 7.6%
Massachusetts
196
161
↓ 18.0%
Michigan
528
492
↓ 6.7%
Minnesota
184
163
↓ 11.7%
Mississippi
344
342
↓ 0.6%
Missouri
463
424
↓ 8.3%
Montana
69
81
↑ 16.8%
Nebraska
120
94
↓ 21.6%
Nevada
205
179
↓ 12.4%
New Hampshire
64
55
↓ 14.2%
New Jersey
326
277
↓ 14.9%
New Mexico
211
191
↓ 9.5%
New York
510
499
↓ 2.2%
North Carolina
763
790
↑ 3.5%
North Dakota
39
43
↑ 9.7%
Ohio
568
602
↑ 6.0%
Oklahoma
326
272
↓ 16.4%
Oregon
253
276
↑ 9.4%
Pennsylvania
534
558
↑ 4.5%
Rhode Island
14
41
↑ 193%
South Carolina
516
521
↑ 1.0%
South Dakota
48
51
↑ 6.1%
Tennessee
607
661
↑ 8.9%
Texas
2,104
2,089
↓ 0.7%
Utah
151
127
↓ 16.2%
Vermont
39
36
↓ 8.7%
Virginia
467
441
↓ 5.5%
Washington
349
368
↑ 5.3%
West Virginia
122
125
↑ 2.6%
Wisconsin
274
261
↓ 4.8%
Wyoming
50
65
↑ 29.0%
U.S. Total*
20,190
19,515
↓ 3.3%
*Puerto Rico is not included (Traffic Volume Trends for Puerto Rico is not available.)
Source: NHTSA
Memphis, TN is the city with the most car accidents fatality rate (34.3 per 100,000 population). Mississippi, South Carolina, and Arizona are the leaders with the highest fatality rate per 100 m VMT. The safest states by this indicator are Massachusetts, Minnesota, and Maine.
Here are the top 10 states with the biggest estimates of the fatality rate per 100 m VMT in the first half of 2023 compared to the 10 the safest:
#1
Mississippi
1.73
+39.52%
#2
South Carolina
1.73
+39.52%
#3
Arizona
1.71
+37.9%
#4
Tennessee
1.58
+27.42%
#5
West Virginia
1.58
+27.42%
#6
Oregon
1.55
+25%
#7
Arkansas
1.54
+24.19%
#8
Florida
1.52
+22.58%
#9
Kentucky
1.49
+20.16%
#10
Delaware
1.48
+19.35%
-
Global US
1.24
-
#41
Hawaii
0.92
-25.81%
#42
New York
0.92
-25.81%
#43
Alaska
0.88
-29.03%
#44
New Hampshire
0.84
-32.26%
#45
Wisconsin
0.83
-33.06%
#46
Utah
0.76
-38.71%
#47
New Jersey
0.73
-41.13%
#48
Maine
0.64
-48.39%
#49
Minnesota
0.58
-53.23%
#50
Massachusetts
0.53
-57.26%

Check out our article “How Much Does a Felony Defense Attorney Cost? Current Rates“
The most common problems leading to death on the road are:
Drunk driving and speeding account for the largest share. So let’s take a closer look at each of these categories.
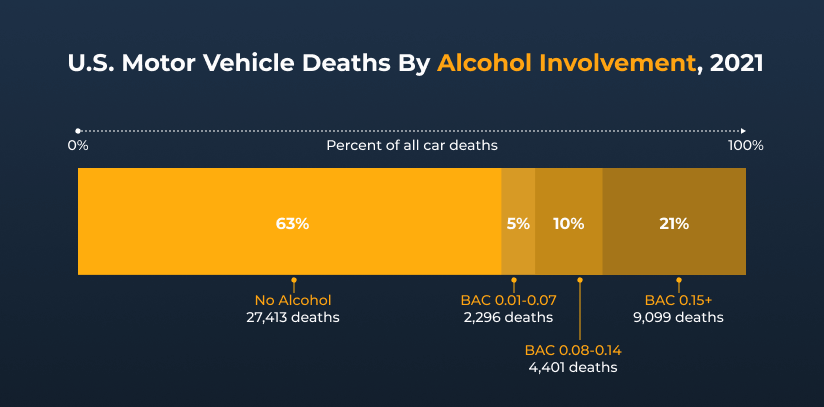
In 2021, about 36% of deaths in road traffic incidents resulted from drunk driving. 21% were due to a significant BAC (Blood Alcohol Content) of 0.15+. Over the past 12 years, this figure is roughly the same – 35% of all deaths on average.
Here’s a breakdown of how many car crashes a year by BAC level.
2011
20,848
1,662
9,865
35.60%
2012
21,563
1,782
10,336
35.98%
2013
20,865
1,834
10,084
36.35%
2014
20,913
1,800
9,943
35.96%
2015
23,165
1,930
10,280
34.52%
2016
24,762
1,984
10,967
34.34%
2017
24,589
1,895
10,880
34.19%
2018
24,186
1,850
10,710
34.18%
2019
24,251
1,834
10,196
33.16%
2020
25,128
2,075
11,718
35.44%
2021
27,221
2,266
13,384
36.66%
Drivers aged 21-24 had the highest percentage (27.19%) of alcohol impairment in fatal crashes. In turn, the 75+ age group has the lowest involvement in deaths due to drunk driving (less than 8%).
Here’s a look at drivers involved in fatal crashes by age and alcohol involvement in 2021:
15 to 20
884
4,204
21 to 24
1,499
4,014
25 to 34
3,531
9,669
35 to 44
2,417
7,874
45 to 54
1,735
7,029
55 to 64
1,284
6,801
65 to 74
589
4,179
75+
253
3,010
Texas, Montana, and Rhode Island are the states with the highest number of drunk driving fatalities. In Texas, 48.42% of all car deaths are due to alcohol-related driving. This is almost 12% higher than the US average.
Here are the top 10 states with the biggest percentage of alcohol-impaired traffic deaths in 2021:
#1
Texas
48.42%
+11.77%
#2
Montana
47.28%
+10.62%
#3
Rhode Island
46.03%
+9.38%
#4
Connecticut
45.64%
+8.98%
#5
Ohio
45.05%
+8.40%
#6
Washington
44.93%
+8.27%
#7
New Hampshire
44.92%
+8.26%
#8
Oregon
44.07%
+7.42%
#9
Iowa
42.13%
+5.48%
#10
South Dakota
41.89%
+5.24%
-
Global US
36.66%
-
Let’s also consider the factors that influence the number of drunk driving deaths:
In general, statistics show that the percentage of deaths among drunk drivers is decreasing. For example, in 1982, this figure was 55%, but now it has decreased by 19%.
Source: NSC analysis of NHTSA FARS data
About 29% of all traffic deaths each year are due to speeding. After a decline since 2010, this percentage began to rise again in 2020.
Here’s how often do car crashes happen due to speeding by year:
2011
10,001
31%
2012
10,329
31%
2013
9,696
29%
2014
9,283
28%
2015
9,723
27%
2016
10,291
27%
2017
9,947
27%
2018
9,579
26%
2019
9,592
26%
2020
11,428
29%
2021
12,330
29%
Drivers aged 25-34 represented the largest group in speeding-related deaths (26%). Also, in 73% of speeding cases, the drivers were male.
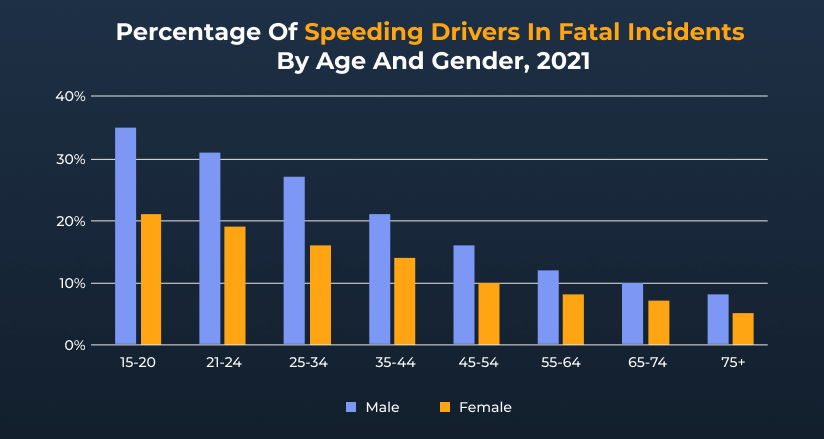
Here is data by age of the driver involved in the cases of road deaths due to speeding:
15 to 20
1,577
13%
21 to 24
1,524
12%
25 to 34
3,158
26%
35 to 44
1,941
16%
45 to 54
1,292
10%
55 to 64
877
7%
65 to 74
418
3%
75+
242
2%
Hawaii, the District of Columbia, and Wyoming are the states with the highest number of speeding traffic fatalities. In Hawaii, 47.87% of all car deaths are due to speeding. This is almost 19% higher than the US average.
Here are the top 10 states with the biggest percentage of speeding traffic deaths:
#1
Hawaii
47.87%
+18.87%
#2
District of Columbia
46.34%
+17.34%
#3
Wyoming
40.91%
+11.91%
#4
Pennsylvania
40.65%
+11.65%
#5
South Carolina
40.57%
+11.57%
#6
Vermont
40.54%
+11.54%
#7
Alaska
40.30%
+11.30%
#8
Connecticut
39.93%
+10.93%
#9
Missouri
39.76%
+10.76%
#10
New Mexico
38.67%
+9.67%
-
Global US
29%
-
It is also worth noting that one of the most influential factors in speeding deaths is the road condition. Thus, 43% of fatalities occur on mud, dirt, or gravel roads.
Source: National Safety Council
That wraps up our look at how many car deaths are in the US each year. Nowadays, the US faces an increase in the number of road deaths. Since the beginning of the Covid-19 pandemic, these figures have already increased by 17.1%. Although the NHTSA predicts a slight decrease in 2023, the fatality rate remains one of the highest in history.
If you or your loved ones have suffered from a traffic injury, consider consulting a car accident lawyer. They will help you get compensation and deal with local law.
2021 saw a record number of approximately 42,939 fatalities in the United States, marking a 10,1 increase from 2020.
On average, approximately 117 people die each day in car accidents in the United States.
A fatal car crash occurs approximately every 12 minutes in the United States.
On average, 2% of all licensed drivers in the US get into an accident every year.
About 0.7% of all traffic incidents are fatal in the United States.